Sensor Network Quickstart Guide
This article will show how to access the Centaur Cloud Platform, connect your devices, and begin viewing live sensor data from your network.
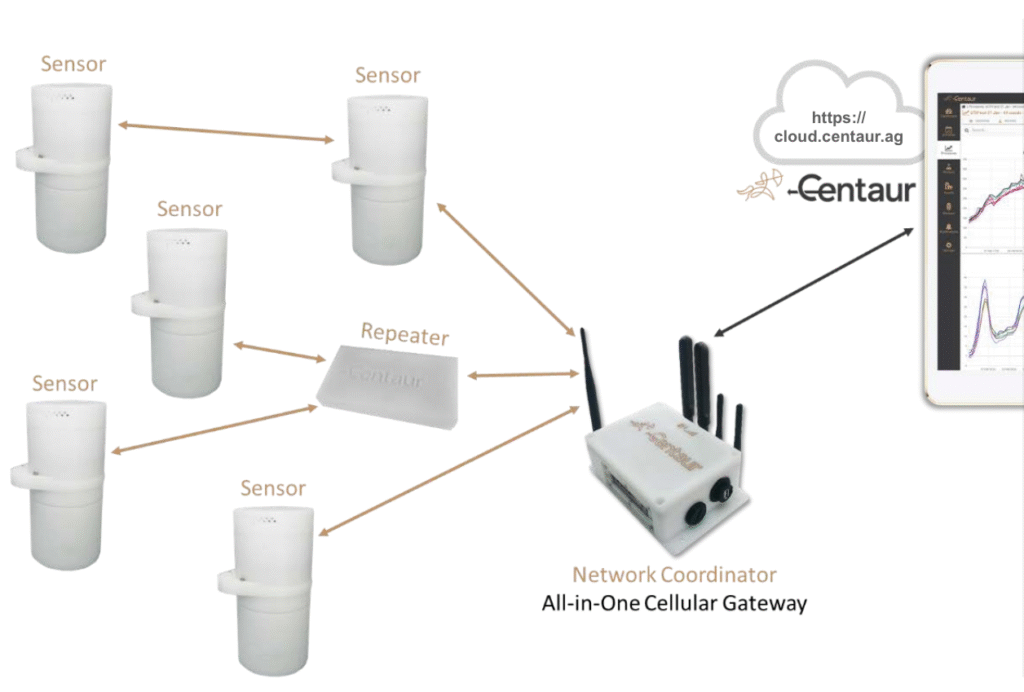
1. System Architecture Overview
The Centaur architecture includes both on-site hardware and cloud infrastructure:
-
Local Installation: Smart Sensors, Wireless Repeaters, and the All-in-One Gateway.
(Please email support@centaur.ag, ideally at least a day before, to inform them of the intended installation time, so they can assist wherever needed and confirm all is in order after install.) -
Cloud Platform: The Centaur Cloud, where users view data, analytics, and alerts.
2. Viewing Devices and Network Status
2.1 Accessing the Platform
Visit https://cloud.centaur.ag/login and log in using the credentials provided by Centaur.
2.2 Accessing Device Manager
Navigate to the Devices tab in the left sidebar.
Here you’ll find:
-
All registered Gateways (left column),
-
The list of connected Sensors per gateway (center),
-
Network status and sampling configuration (right).
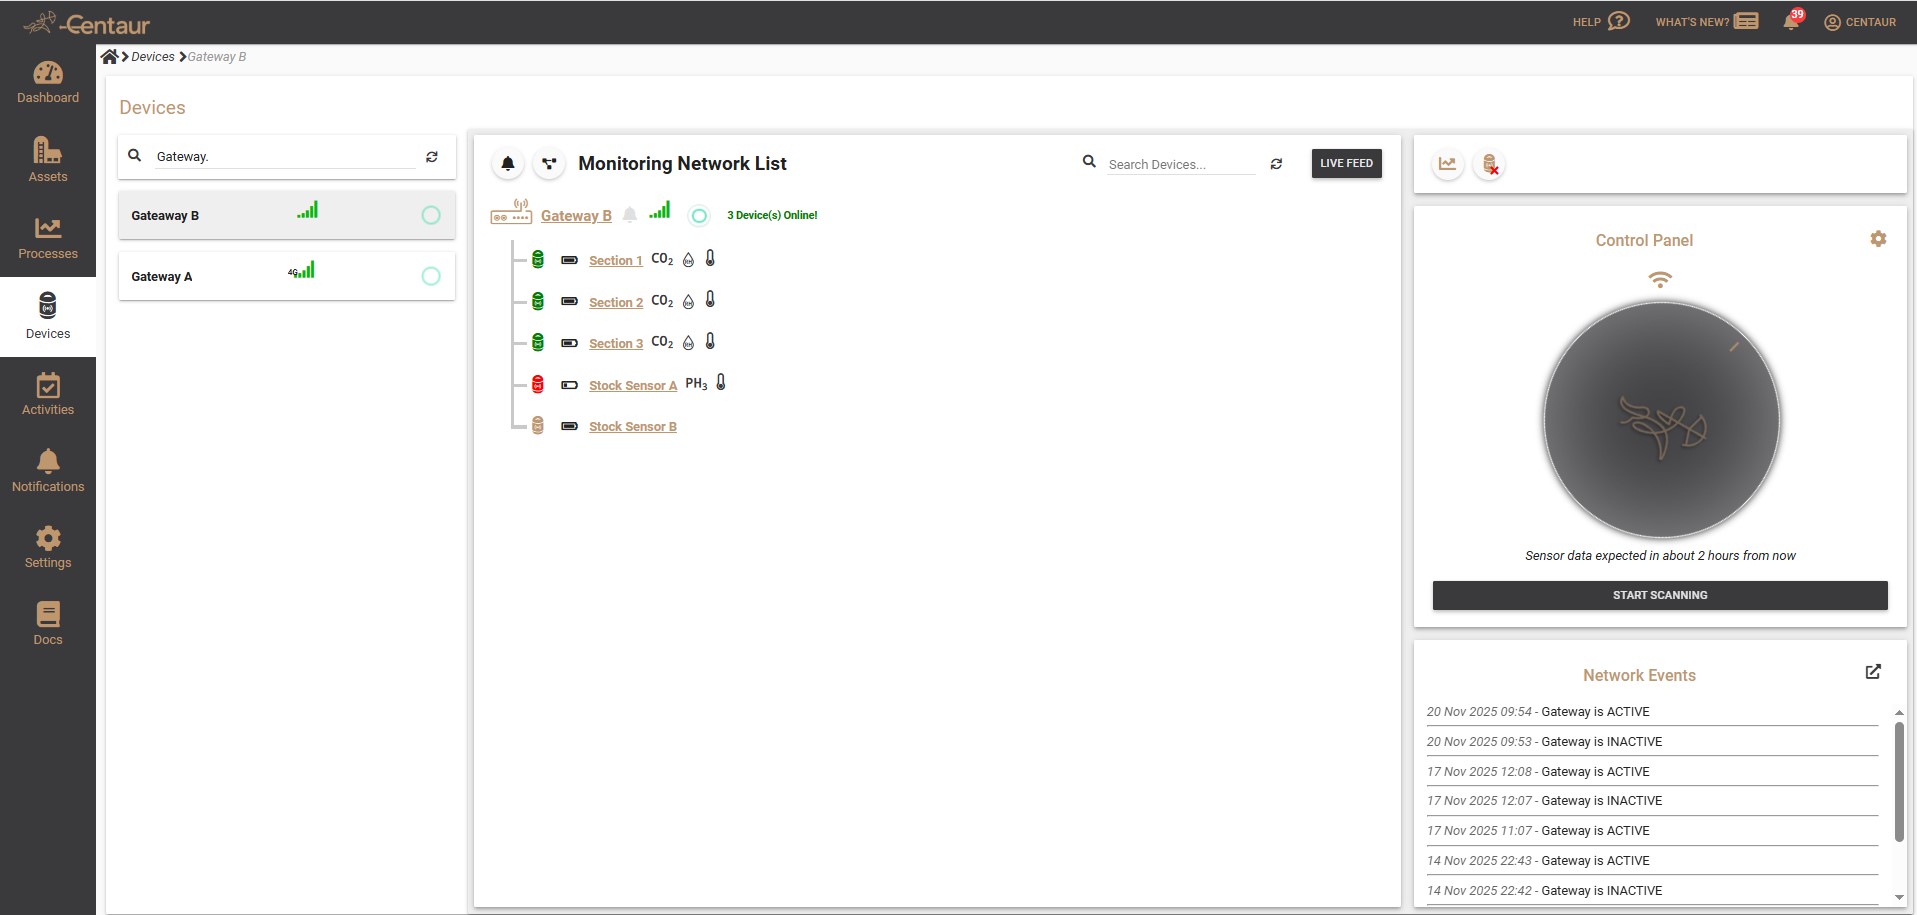
When your All-in-One IoT Gateway is correctly configured, it will appear under Devices with a green flashing dot, confirming it’s online and communicating with the Centaur Cloud.
3. Setting Up the Sensor Network
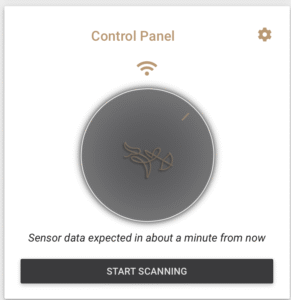
3.1 Initiating Network Discovery
To pair new sensors or verify existing ones:
-
Click Start Scanning (bottom-right corner).
-
The gateway will enter a 1-minute wake cycle to detect nearby devices.
-
Keep sensors within a few meters of the gateway until they appear listed.
The scan mode allows fast discovery and real-time monitoring as sensors are deployed to their final locations.
3.2 Understanding Sensor Status Indicators
|
Indicator |
Meaning |
|---|---|
|
|
Sensor actively communicating |
|
|
Communication did not communicate in recent cycles |
|
|
Sensor inactive or deactivated since before Gateway was rebooted |
If any sensors lose connection (red), deploy a Wireless Repeater or move the sensor closer to improve mesh communication.
Once all devices are in their final deployment position and remain green, click Stop Scanning and, using the gear button on the top right of the Control Panel, choose a sampling interval up to 4 hours.
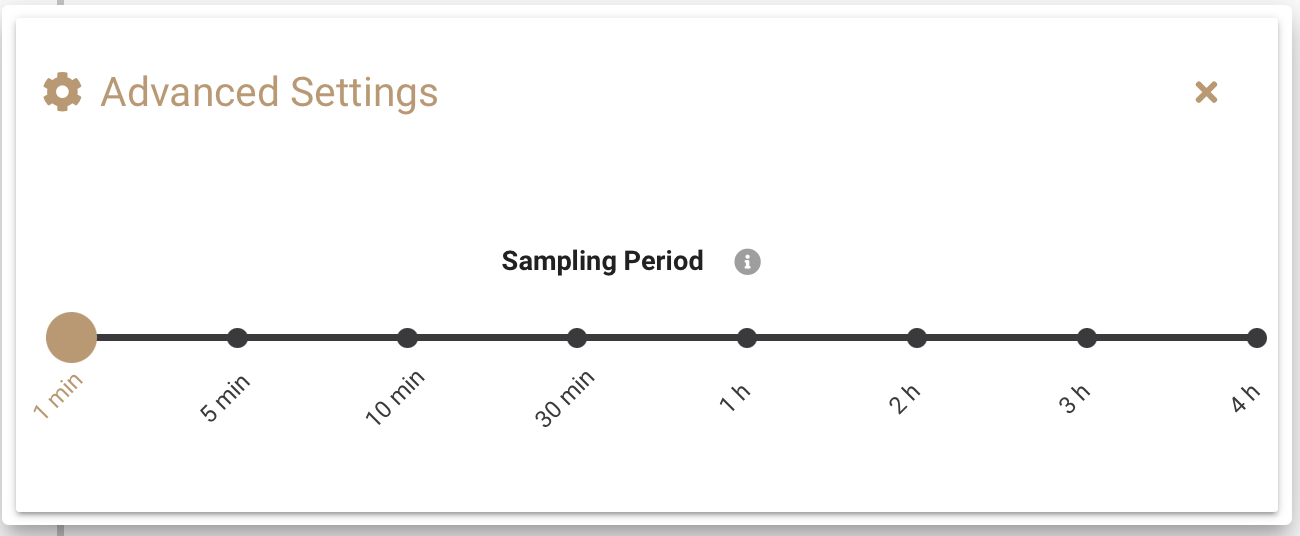
Recommended: Use intervals ≥3 hours to conserve battery power.
4. Viewing Live Data and Starting Monitoring
Click Live Feed to display real-time readings from connected sensors, including temperature, humidity, CO₂, and O₂ values.
Click Start Monitoring to launch a new monitoring process, linking sensors to an asset and analytics workflow.
See related documentation for detailed process setup (“How to Create a New Process”).
Summary
You have now:
-
Logged into the Centaur Cloud,
-
Viewed your devices,
-
Activated and verified sensor connectivity, and
-
Begun monitoring live conditions.
Your network is now active and synchronized with the Centaur Internet-of-Crops® platform.