Working with CO2 gas sensors for grain condition monitoring
This article explains how Centaur® sensors and the Internet-of-Crops® helps users monitor gas concentrations, such as CO₂, in grain silos to detect early signs of spoilage, mold, or insect activity.
1. Identifying Issues with Elevated CO₂ Levels
Monitoring the concentration of gases, such as CO₂, within a silo offers significant benefits for early spoilage detection. Gases like CO₂ are directly linked to grain respiration, mold growth, and insect activity. Sensors can detect changes in gas concentrations up to 100 times faster than changes in temperature or relative humidity, providing a more immediate indication of potential issues.
Centaur’s platform compares real-time sensor data with predictive model simulations (see Figure 1). If substantial deviations are detected, the system alerts the user (see Figure 2) to take corrective actions.
High CO₂ levels may signal grain spoilage or insect activity. If such levels are detected, users should take grain samples for further analysis and consider implementing one of the recommended remediation actions outlined in this guide.
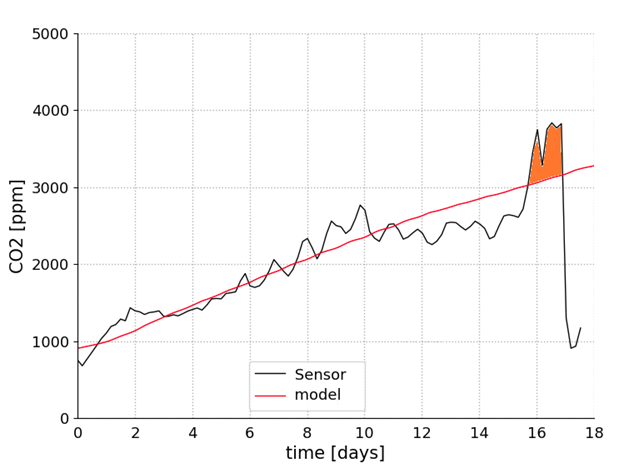
Figure 1. Time evolution of CO₂ concentration in a silo. The black line represents real-time sensor data, while the red line shows the model’s predicted CO₂ concentration. The orange-shaded area indicates a significant deviation between the measured data and the model’s prediction, suggesting potential spoilage or other issues.
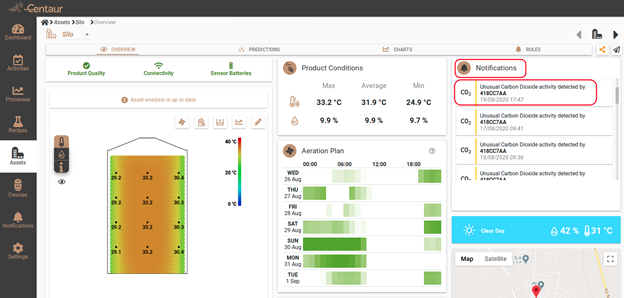
Figure 2. Example of a user notification for unusual CO₂ activity, alerting the user to take further action.
2. CO₂ Frequency Chart (Period Overview)
The CO₂ Chart available in Asset Overview displays all CO₂ measurements collected during the selected time period (for example, Last week or Last month). This view provides a high-level trend of CO₂ concentration inside the asset and is used to identify general patterns, anomalies, or periods of increased biological activity.

Figure 3. CO₂ chart plotting measurements in the selected period.
2. CO₂ Detail Chart (Day-by-Day View)
The CO₂ Detail Chart – available by clicking the Zoom button at the top right of a Frequency Chart – presents measurements on a day-by-day basis. Each day’s readings are visualized individually, allowing more precise inspection of daily variability, fluctuations, and peak values.
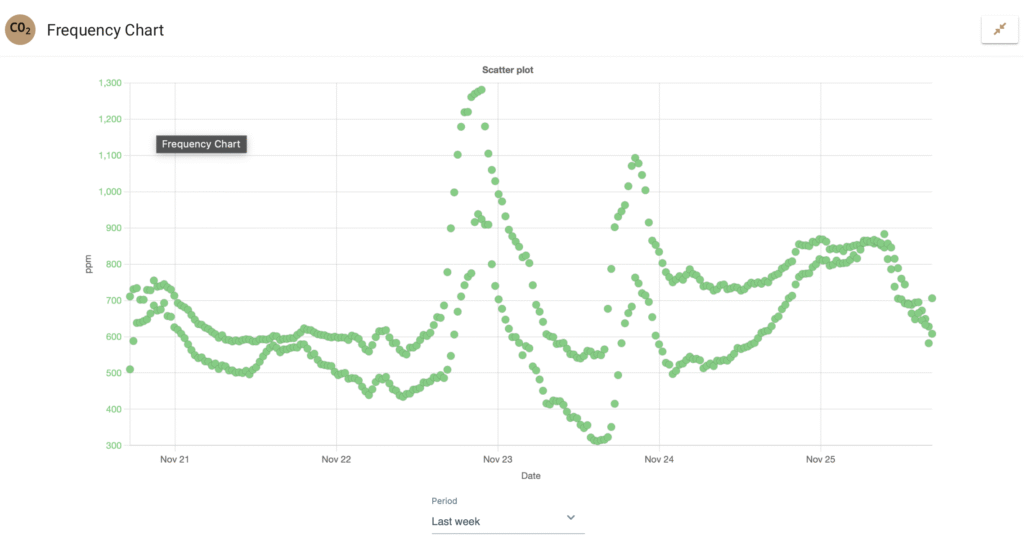
Figure 4. CO₂ detail chart plotting daily measurements